Opscan Reports
Opscan reports provide instructors with data-driven insights to enhance teaching and learning. They help identify areas of improvement and enhance the quality of the questions, guiding more effective instruction. Students benefit from personalized, transparent feedback, that which supports their academic growth. The reports also streamline grading and Canvas integration, saving time and reducing errors. They also offer a view of class performance and test reliability, while helping identify students who may need extra support.
Basic Reports – For all Opscan users
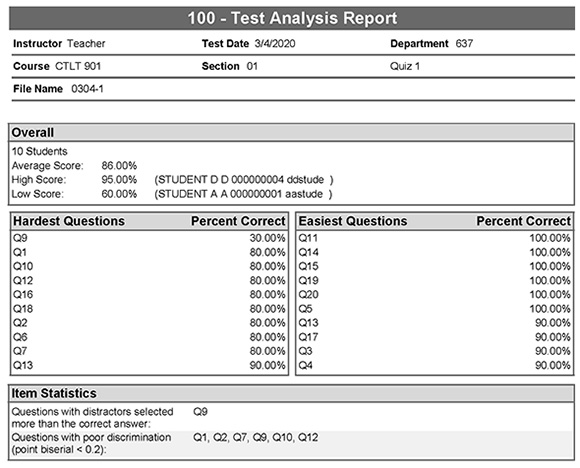
100 – Test Analysis: Summary of test stats – high/low scores, average, easiest/hardest questions, and distractor effectiveness.
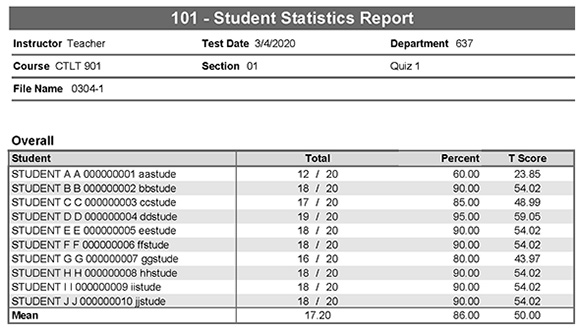
101 – Student Statistics: List student scores several different ways: weighted, percentage, and T scores.
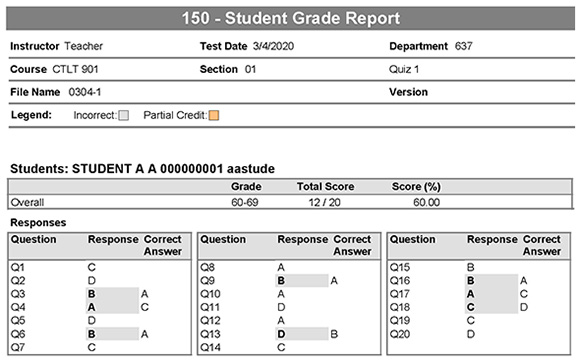
150 – Student Grade: Individual student sheets showing selected vs. correct answers; incorrect answers bolded.
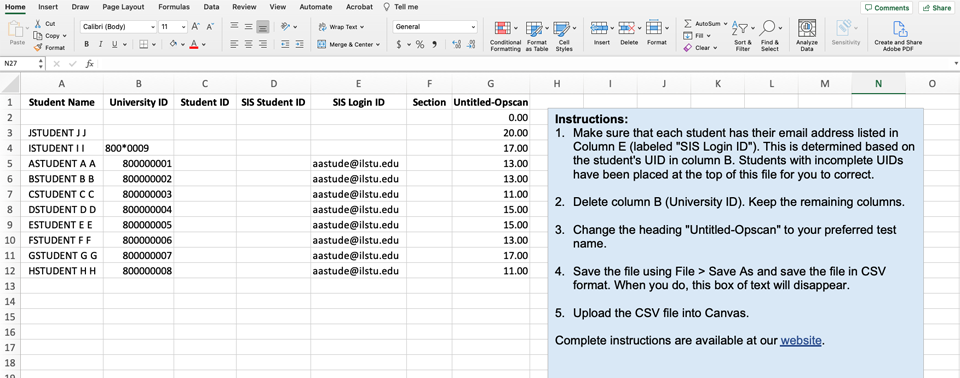
Excel - Scores for Canvas: Excel file for easy Canvas grade import (see online instructions).
Intermediate Reports – Class and question-level insights
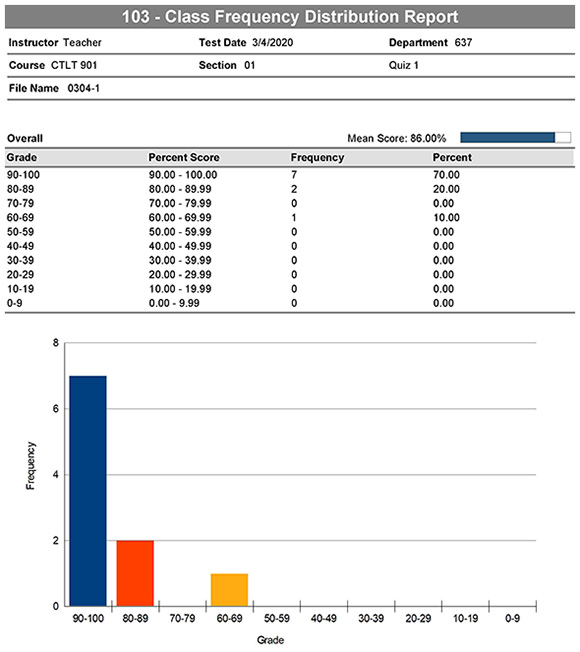
103 – Class Frequency Distribution: Score distribution by percentage ranges (e.g., 90-100, 80-89, etc.).
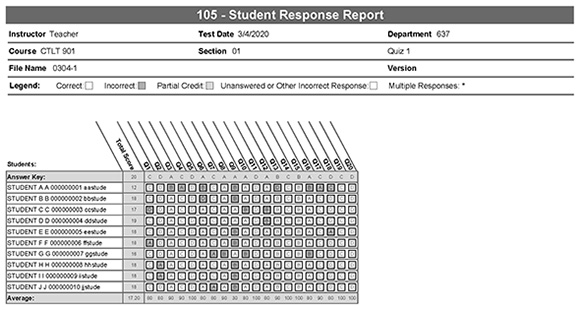
105 – Student Response: Matrix of student answers by question; includes class-wide difficulty percentages.
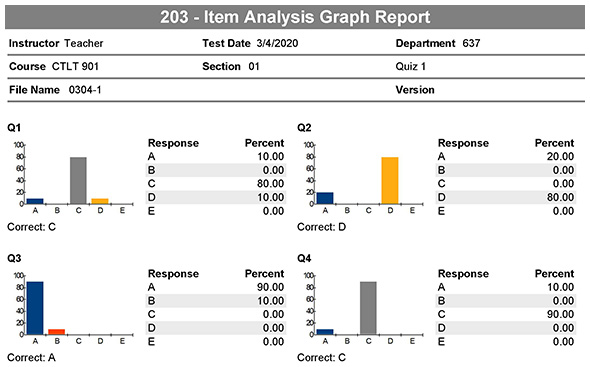
203 – Item Analysis Graph: Graphical breakdown of answer choices per question.
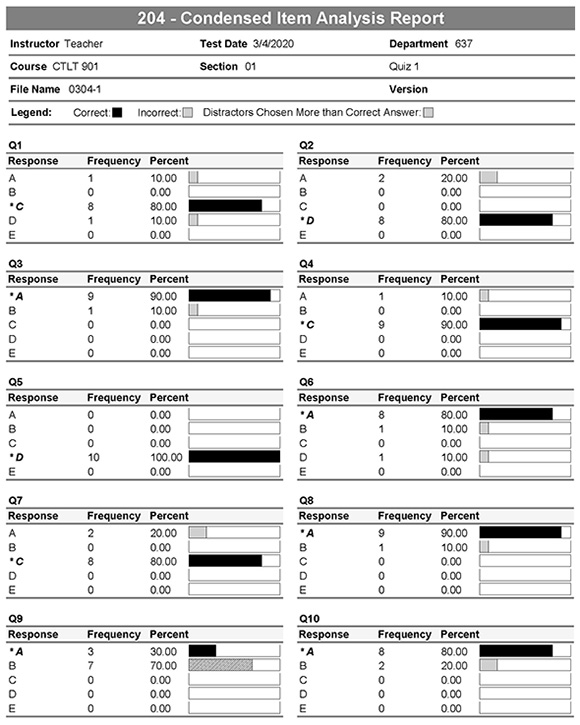
204 – Condensed Item Analysis: Graphical breakdown of answer choices per question. Highlights questions where incorrect answers were more common than correct ones.
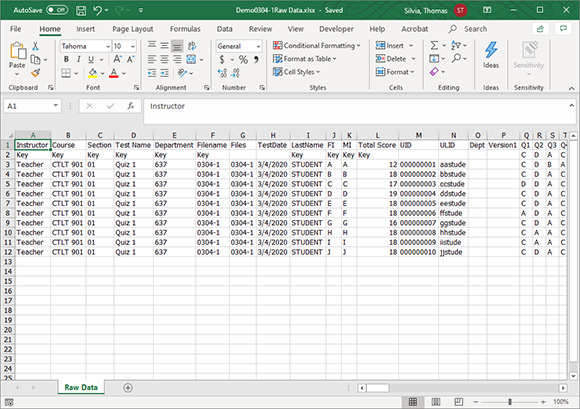
RAW – Raw Data: Excel file with answer key and all student responses.
Specialty Reports – Advanced Insights
These reports address specific questions, such as the correlation of certain questions to test scores, standardized statistics like the KR20, and identifying students who may need special assistance to gain confidence in course content.
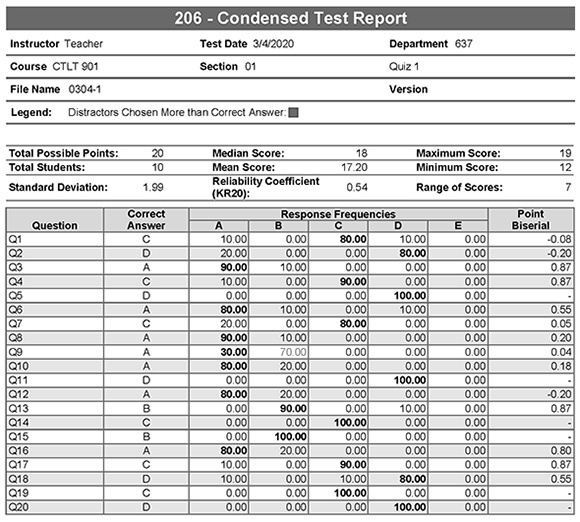
206 – Condensed Test: Shows percentage correct, common wrong answers, and point-biserial statistic per question.
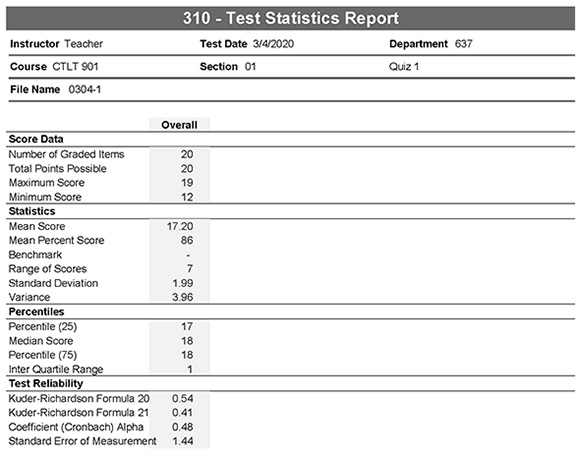
310 – Test Statistics: Summary of test reliability, score range, mean, and median. Includes statistics to help you assess the reliability of your test.